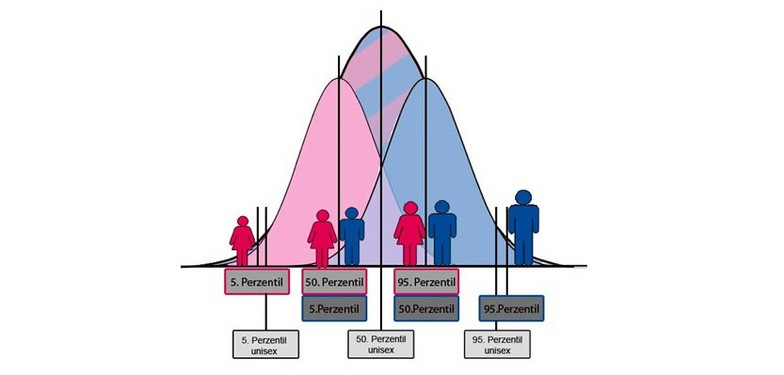
Unisex models cover only approximately 80% of the dimensional range of a population. Conversely, if the data are evaluated separately by sex, approximately 90% of the dimensional range is covered. Depending upon the design task and particular aspects of the target group, this may have a considerable influence upon user comfort.
Despite this, data are also stated that have been evaluated according to the unisex model, resulting in the percentiles stated for description of the population applying without differentiation by sex. As a result, the data are combined without regard to sex and evaluated as a single group (see image below).

This form of analysis and presentation yields a comparatively narrower dimensional range than would be the case if the presentation were to distinguish according to sex. For example, the 5th percentile value of the body height produced by a unisex analysis of a random sample would be higher than the value produced if only women were considered. Equally, the value for the 95th percentile yielded by unisex analysis of the random sample would be lower than if only men were considered.